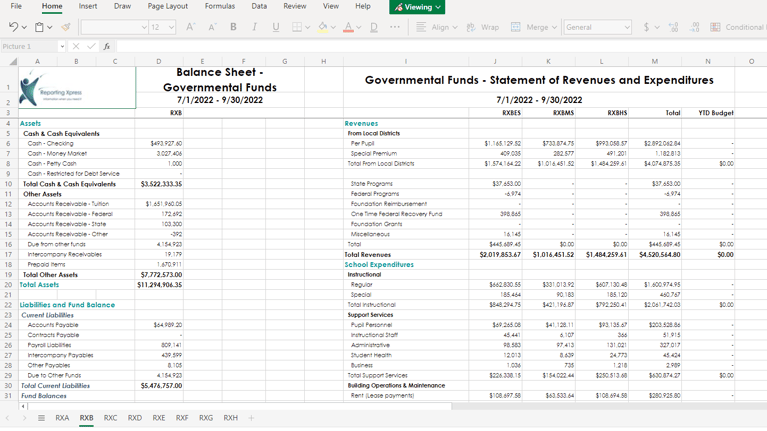

Some organizations like to see a presentation of their financial numbers with the income statement and balance sheet information on the same page. Creating that report usually requires manual manipulation of other standard reports in Excel, which can be a tedious low-value use of a CFO, Controller, etc.'s time.
This is a perfect scenario to solve with a reporting as a service platform. Automated reports can combine multiple data types on a page. A custom visual chart organizer can be incorporated to determine the accounts to include in each row and a segment in the account number may be used as a column filter. The sample version shown here also includes a budget column. That budget could come from within Financial Edge, or be automatically ingested as an excel or other file at report run-time.

It is difficult to see this entire report in a blog-post because of the vertical length. If you would like a copy of the full sample report, send an email request to info@ReportingXpress.com.
The custom visual chart organizer is a pretty slick tool. It allows you to control which accounts are included in each line of the report. The primary benefit of this is to simplify reporting for presentation purposes by compressing the report into fewer rows that combine data from multiple original rows. You can update the visual chart organizer at any time. Each time the report is run, Reporting Xpress will ingest the visual chart organizer and the report will be automatically adjusted to whatever parameters you have included in the most recent version of the file.